Timeline
 Photo by Aron Visuals on Unsplash
The post was last updated on 2022-03-01.
This summary of the history of redox measurements (predominantly in soils) is based on literature I had cited previously. Please give me a note and I will edit the timeline with further findings if you wish. This overview focused on redox electrode but their are other tools that can be used to qualitatively (or quantitatively) to characterize or even monitor reducing conditions. These are:
- EH measurements by redox electrodes
- Dyes that indicate the presence of, e.g., Fe2+
- IRIS tools (Indicator of Reduction In Soils) that indicate Mn and Fe reducing conditions by dissolution of synthetic minerals
- Others (e.g.)
- Iron metal rods
- Terminal electron accepting processes (TEAPs) approach
- Oxidative capacity (OXC) approach
- …
📚 More information with emphasis on technical advancements can be found in the PhD thesis from Sabine Fiedler: Fiedler, S., 1997. In-situ-Langzeitmessungen des Redoxpotentials in hydromorphen Böden einer Endmoränenlandschaft im württembergischen Alpenvorland, Universität Hohenheim, Stuttgart.
The following static timeline (💯 % ggplot) is more general of the most important findings with major breakthroughs related to the platinum redox electrode:
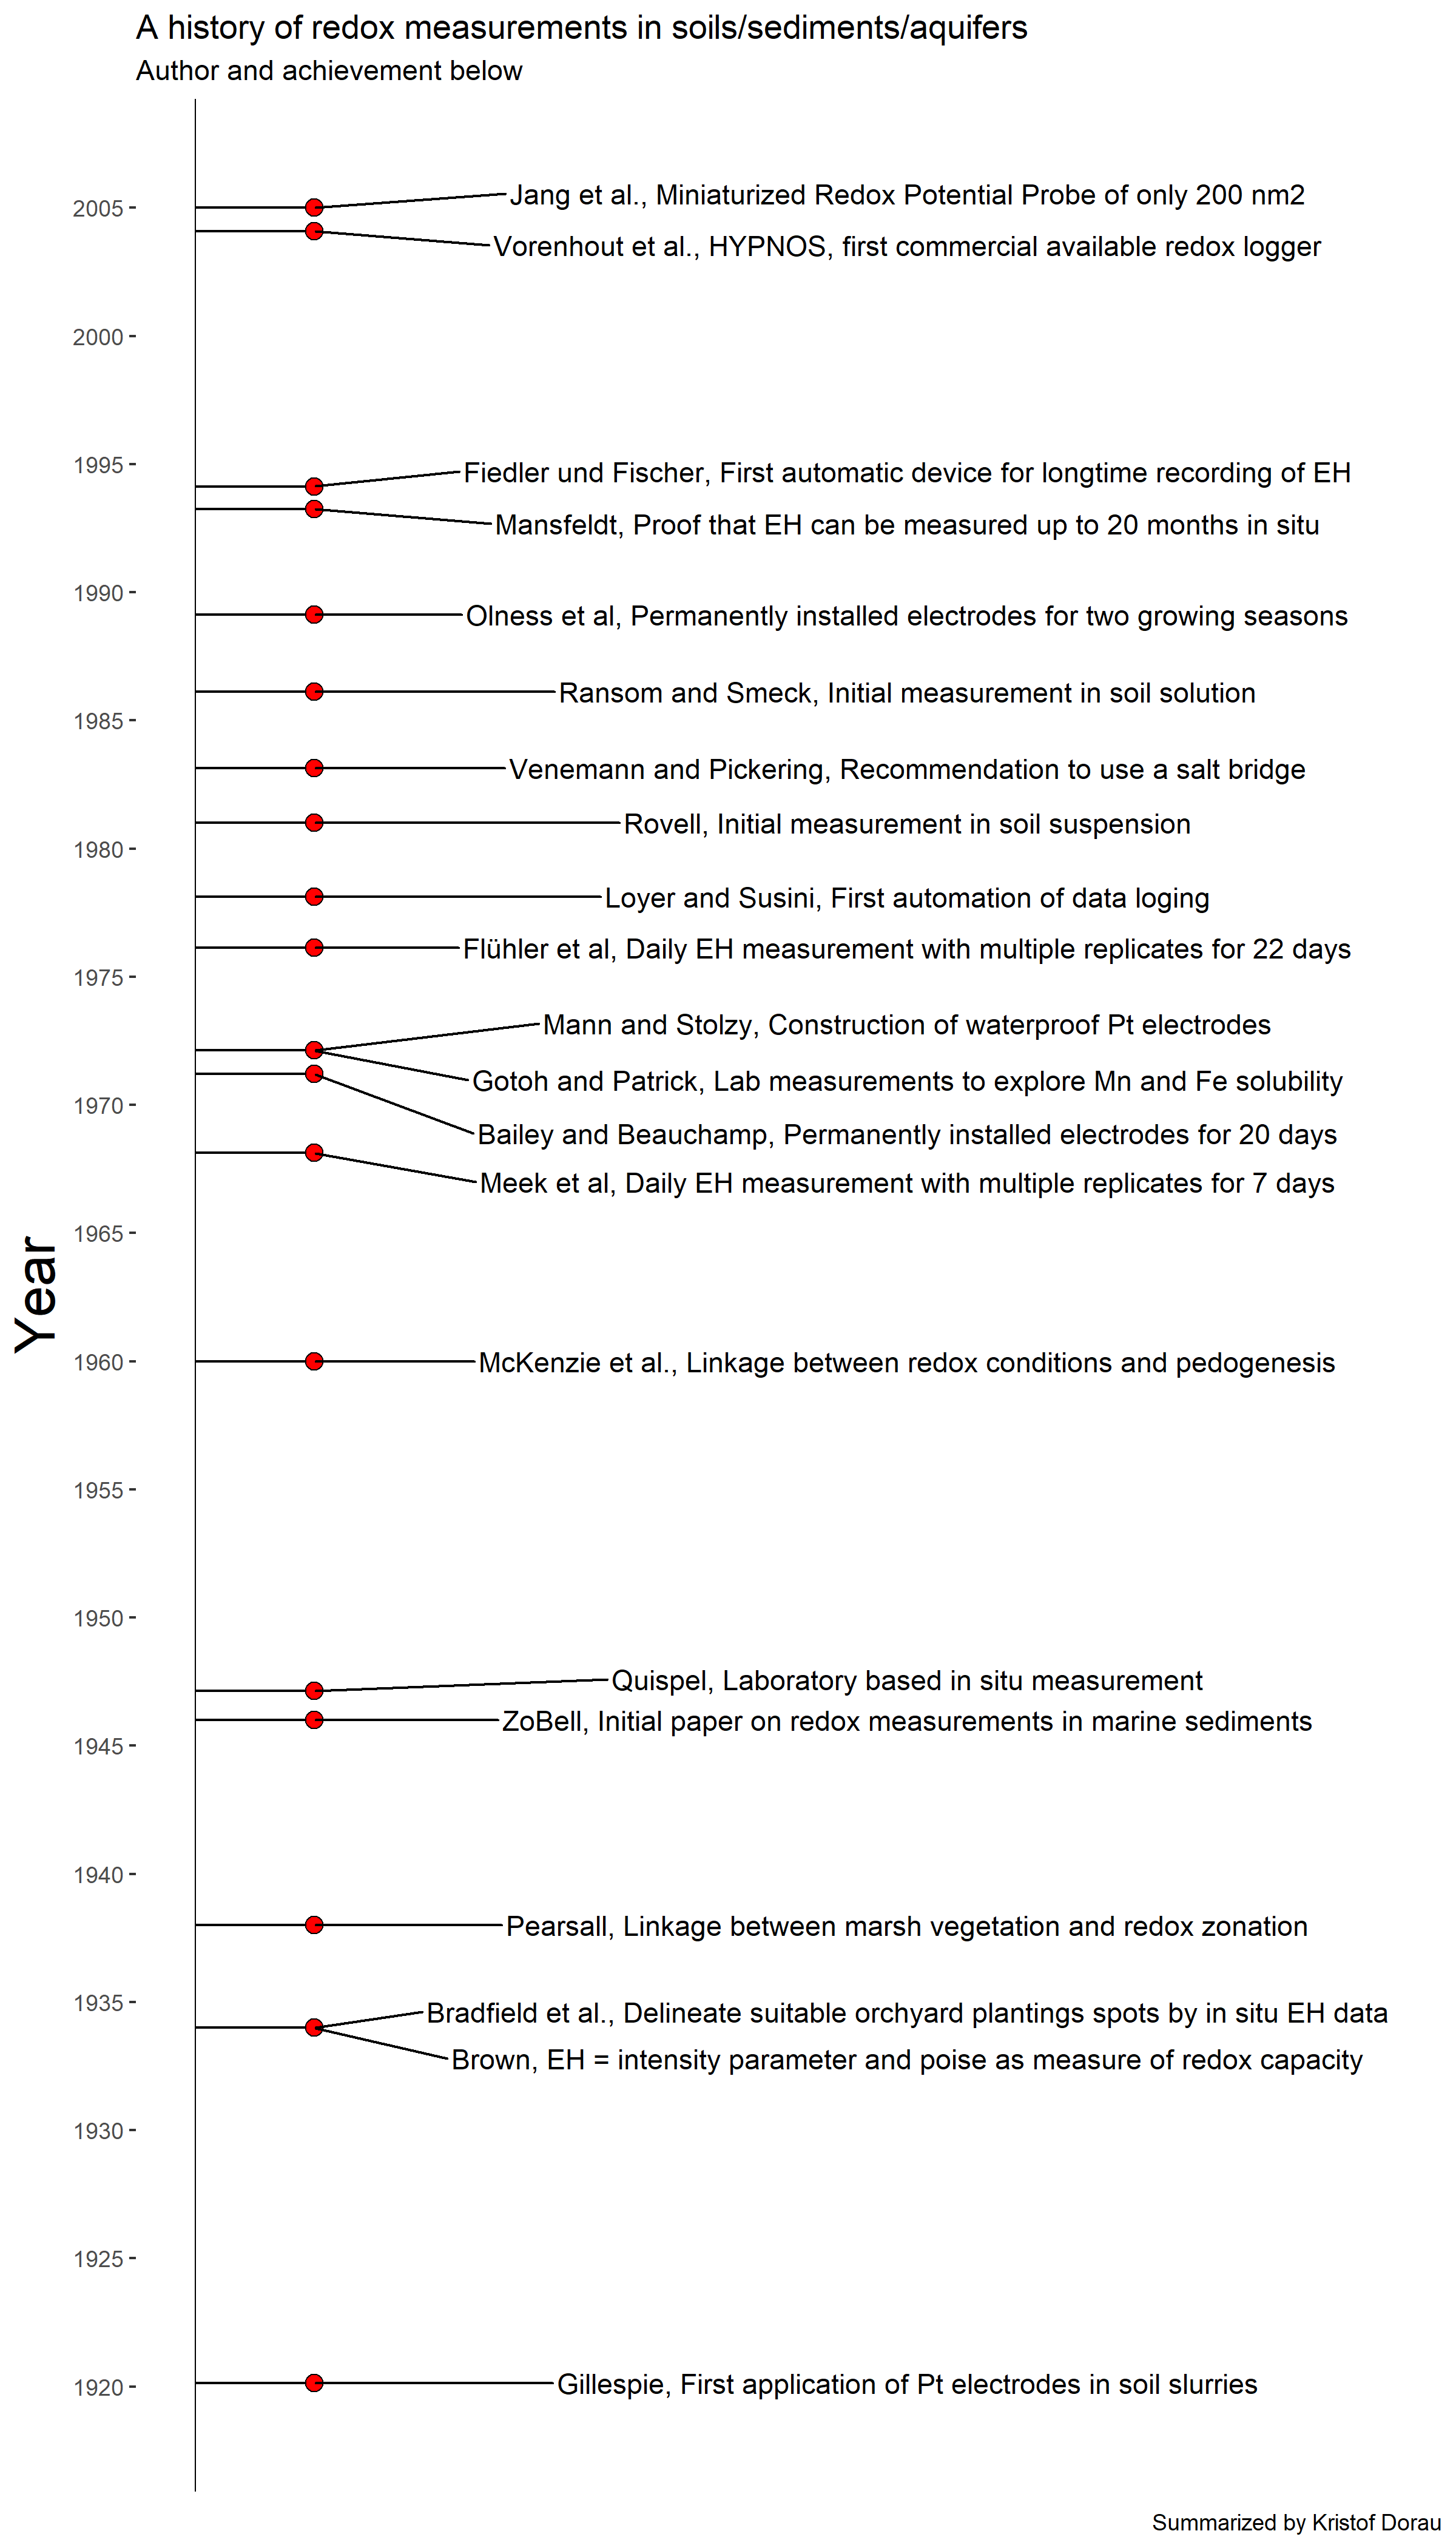
Figure 1: Timeline of important findings related to the measuring of redox potentials in soils
Kristof Dorau
Research assistant
My research interests include redox dynamics in soils, environmental monitoring and recently data analysis in R.