Interpretation of redox measurements
The post was last updated on 2022-02-23.
As outlined in the introduction, redox potentials have a huge importance in soils and sediments since the data enables to obtain insights into particular processes that take place. Even though the measurement is very valuable, the interpretation is not so easy and people must be cautious. Hence, “measured values of EH obtained from a Pt electrode thus have only qualitative significance in soils” (Sposito, 2016) and the application, “in common with so many other measurements in nature, is in their interpretation by a knowledgeable observer” (Bohn, 1971).
Here are some general rules of thumb:
- Only use integer values, a decimal place is not required ❗
- Some authors argue that values up to 50 mV have little meaning. Thus, if one value is 480 mV and the other is 490 mV there is no actual difference between the measurements. Keep in mind that the EH in soils ranges between -300 and +700 mV.
- It is sometimes better to interpret the development of the EH (is it increasing/decreasing; is the decrease straightforward or stopped) than only consider a snapshot in time.
- Don’t take individual readings from only one Pt electrode as valid. In most of our studies we employ at least three individual electrodes per depth. Some authors suggest to use even eight to ten electrodes per depth (Cogger et al. 1992).
- Working with the mean and the standard deviation from a time series is good, but even better is to give information about the distribution of redox classes.
I will illustrate the bullet points above in the following. The data is taken from our study site at Polder Speicherkoog (see this post to see what the site features):
How can we account for spatial heterogeneity?
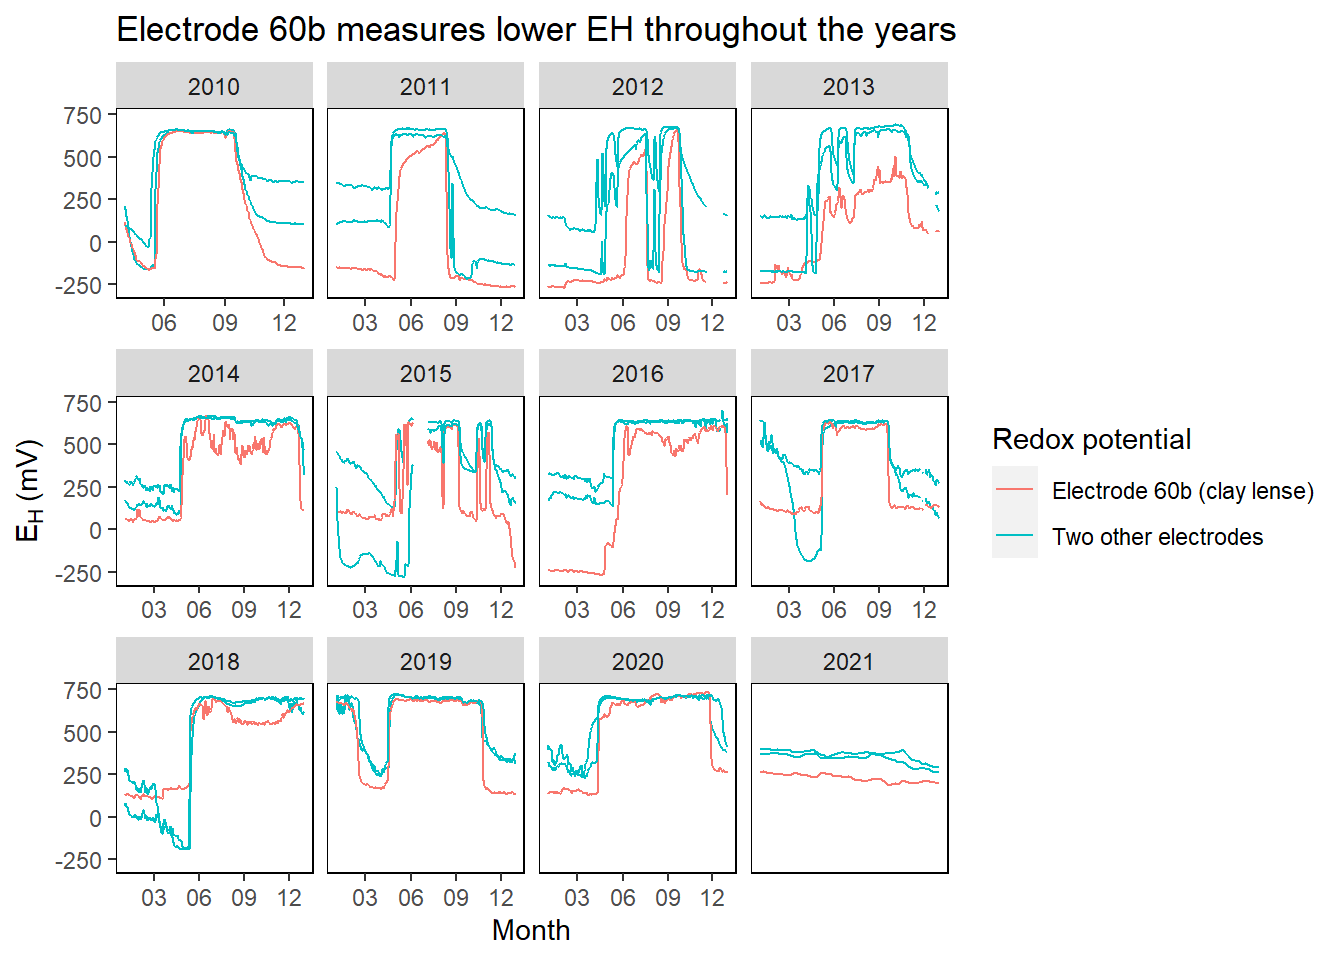
We can see that one electrode (60b) measures a lower EH throughout the years, thus, averaging the data per depth might be partially misleading or at least, we loose some information.
| eh60a | eh60b | eh60c |
|---|---|---|
| 437 | 262 | 406 |
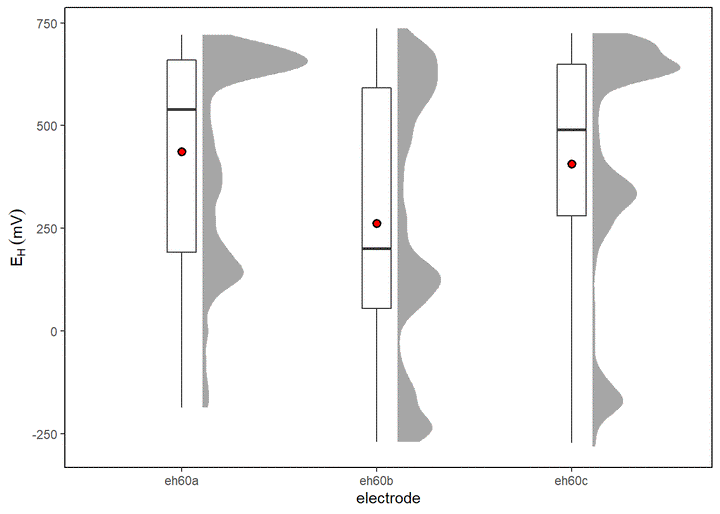
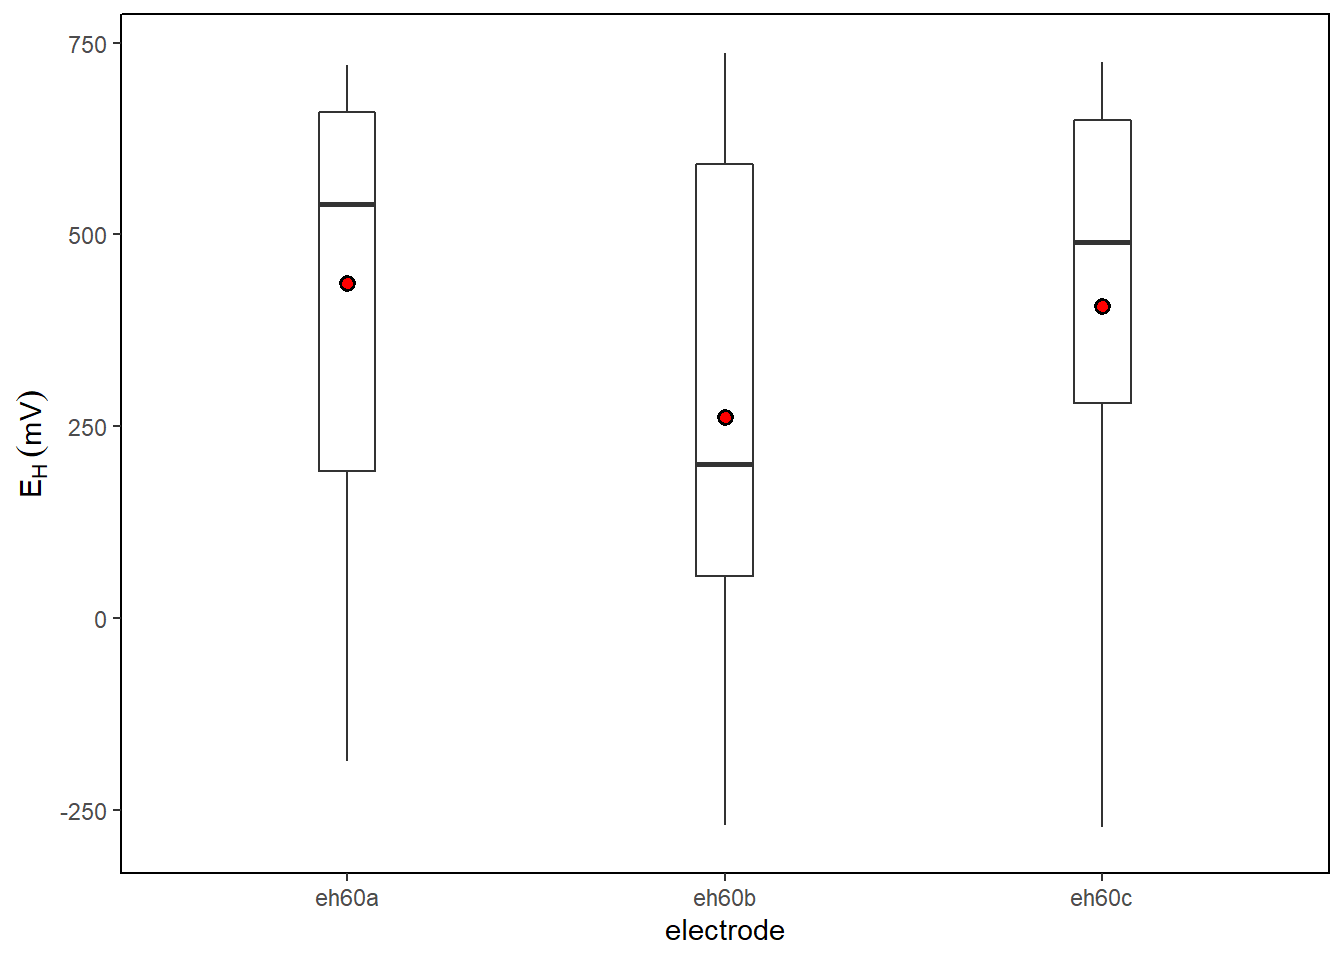
Boxplots are good and robust tools to visualize the distribution of data and in conjunction with the data behind the boxplot (e.g. by jittered points or as density distribution with the area within this example) even more powerful. Most of the data occurs under oxidizing conditions between 500 and 750 mV and and we can easily see, that the EH for electrode 60b is lower with 260 mV compared with 440 (electrode 60a) and 410 (electrode 60c). This would be a good way to visualize the differences for electrodes from the same depth.
What might be the reason for this behavior? “Higher OC and clay contents presumably caused stronger reducing conditions around the Pt electrode (as a result of higher microbial activity and soil moisture), supporting the assumption that one out of three Pt tips dips into the clay lens and, in general, causes strongly reducing soil conditions.” Dorau and Mansfeldt, 2016
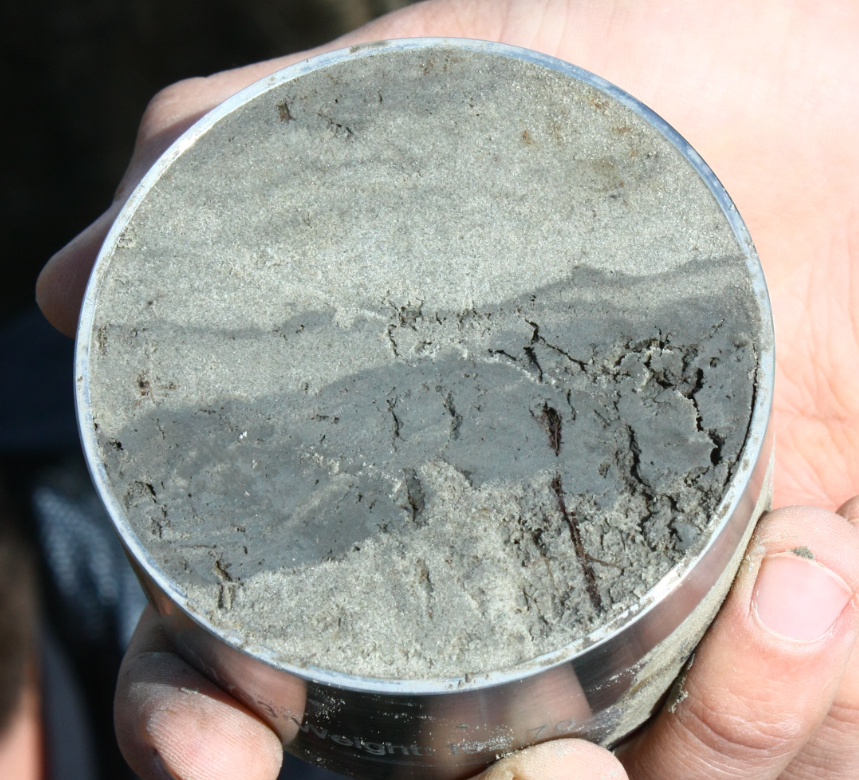
Figure 1: Steel cylinder taken from the depth where the Pt electrodes were placed
However, some of the information is certainly lost because a boxplot does not tell at which time of the year a drop or increase in EH occurs. Therefore it might be a good idea to split down the data on a monthly basis:
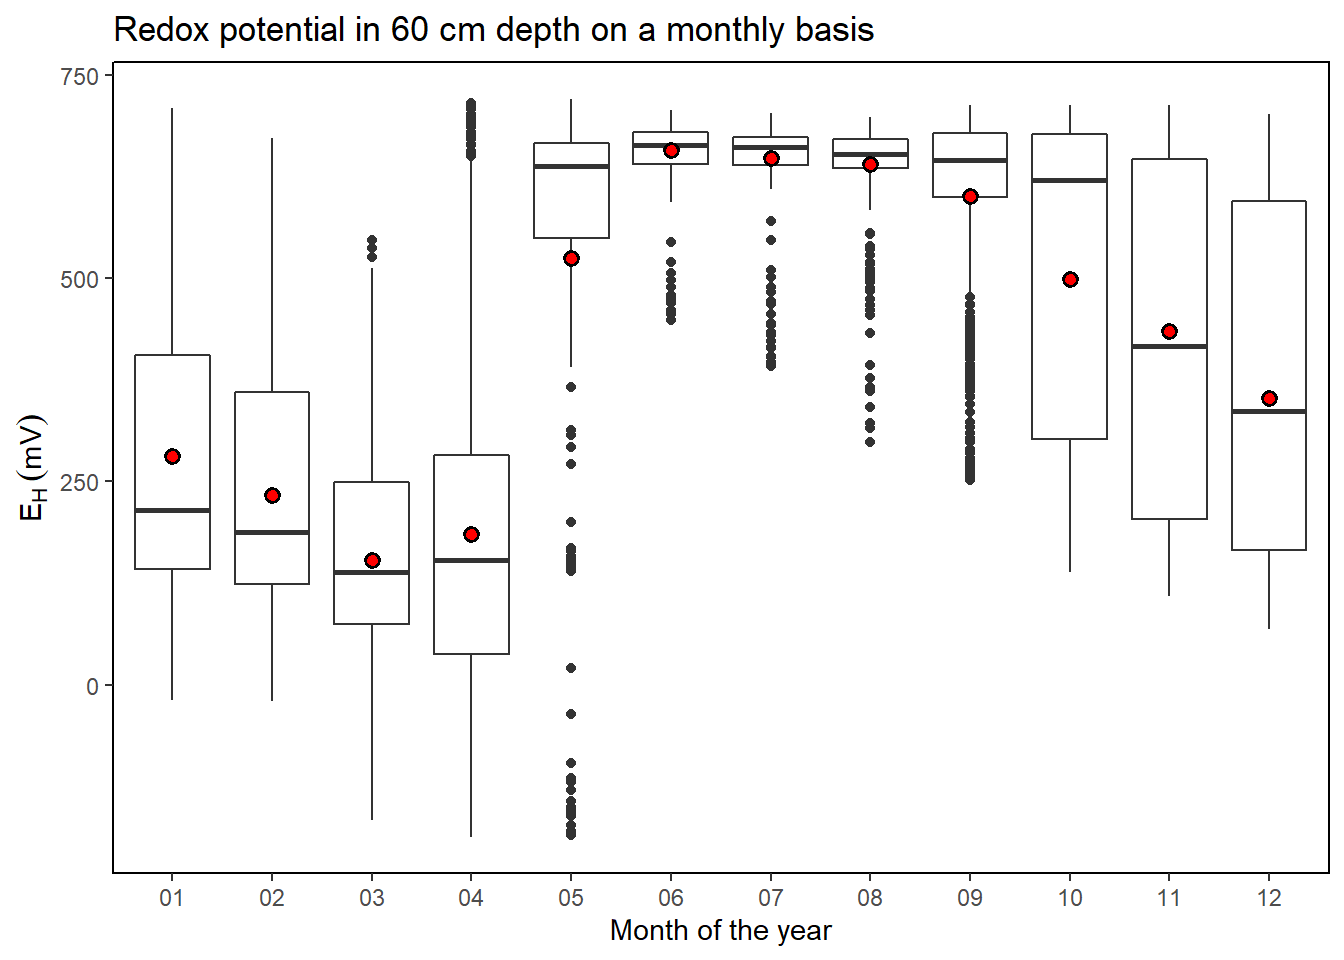
We can see that the EH is at weakly reducing conditions from January to April and strongly increases towards May associated with a drop in water table (data not shown) and successive aeration of the soil profile. This gives a good but still coarse impression of the temporal dynamics. However, down scaling on hourly basis might be a good idea to have a better impression about the aeration process.
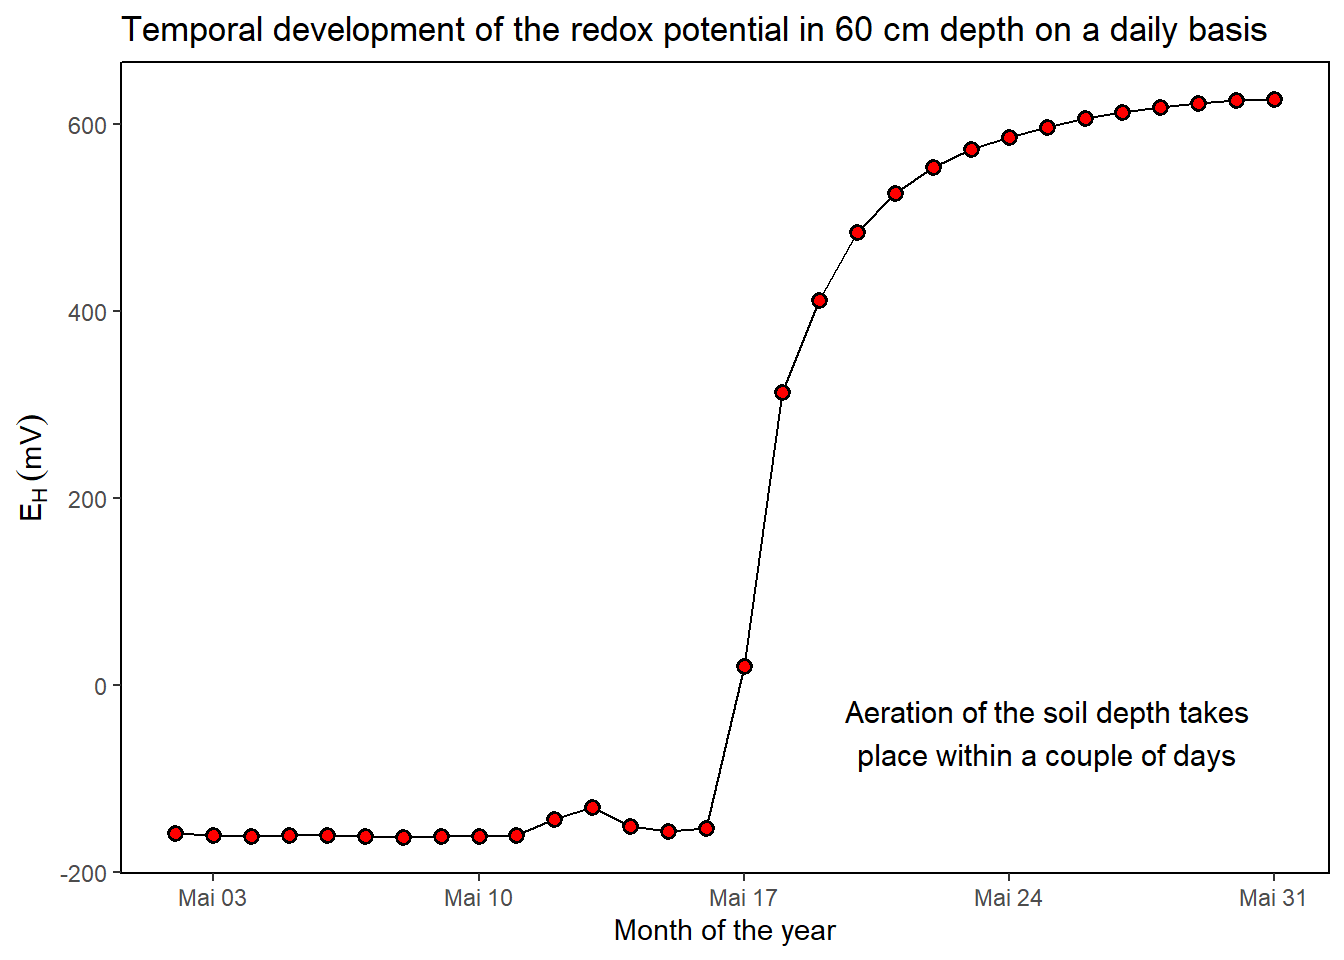
If manual readings are taken during this particular moment, obviously, the moment to conduct the measurement tells a lot about the conditions. “Careful consideration should therefore be given to establishing a precise moment for measurement in the monitoring program (e.g., for sampling of soil solution). Nevertheless, even daily EH readings can be subject to short- comings. Characterization of the soil redox status in the field at 7 am (40 mV) compared with 8 pm (420 mV), will lead to a faulty and misleading interpretation of the in situ biogeochemical conditions.” Dorau and Mansfeldt, 2016
Finally, some words about redox classes in soils and why a differentiation is important (more details can be found here). Below we can see the EH for the particular year 2011.
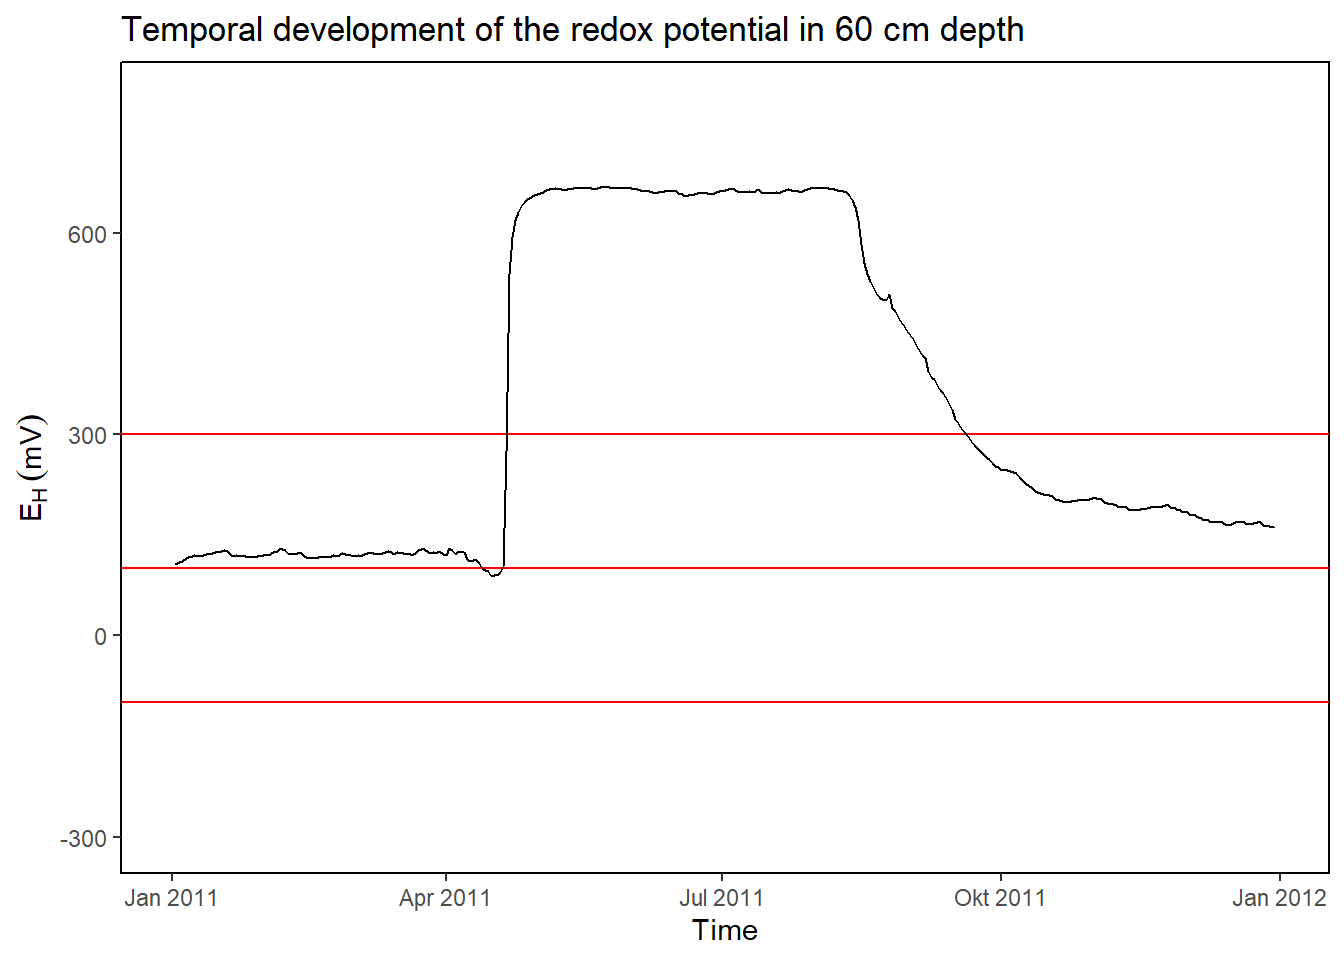
| mean | SD |
|---|---|
| 346 | 234 |
We could tell that the EH is 346 ± 234 but thereby a lot of information is lost that we want to highlight for others. A better way would be to tell for how much of the time the EH prevailed within a particular redox class, for instance:
- oxidizing conditions prevail for 41% of the time
- weakly reducing conditions prevail for 56% of the time
- moderately reducing conditions for only 3% of the time
- strongly reducing conditions were not achieved
Kristof Dorau
Research assistant
My research interests include redox dynamics in soils, environmental monitoring and recently data analysis in R.